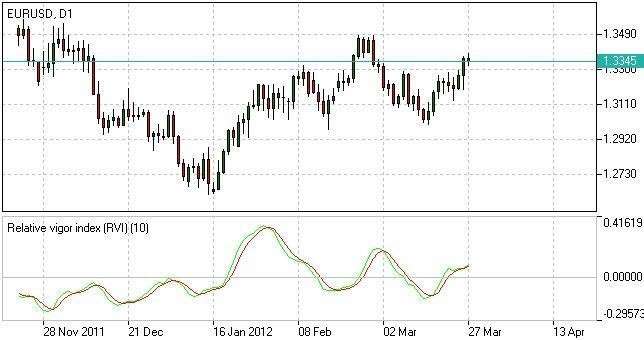
Relative Vigor Index
The Relative Vigor Index (RVI) is a technical analysis indicator that measures the strength of a trend. It compares a security’s closing price to price range and creates an analysis of the price movement.
Using the RVI Indicator
The Relative Vigor Index identifies the changes in the price movement. Therefore, it can be used in convergence or divergence pattern analysis.
- The higher the level that the indicator shows, the stronger the price increase is.
- The lower the level that the indicator shows, the stronger the price drop is.
The RVI shows two lines: the red (signal line), which is the RVI’s 4-period moving average and the green (indicator), which identifies price changes.
- When the signal line crosses from above, it signals a good selling opportunity.
- When the signal line crosses from above, it signals a good buying opportunity.
Photo taken from www.ifcmarkets.com
Relative Vigor Index Formula
The RVI Calculation determines the price change for a specific period divided by the price changes in maximum range within that period. The averaging was based on the 10-period Simple Moving Average to reduce dependence on strong price volatility.
Relative Vigor Index (1) = (Close – Open) / (High – Low)
Relative Vigor Index (10) = 10-period SMA of Relative Vigor Index (1)