Relative Strength Index (RSI)
The Relative Strength Index (RSI) is a momentum oscillator that measures the speed and change of recent price movements. It compares bearish and bullish movement to a specific asset’s price in the trading chart.
RSI Trading Strategy
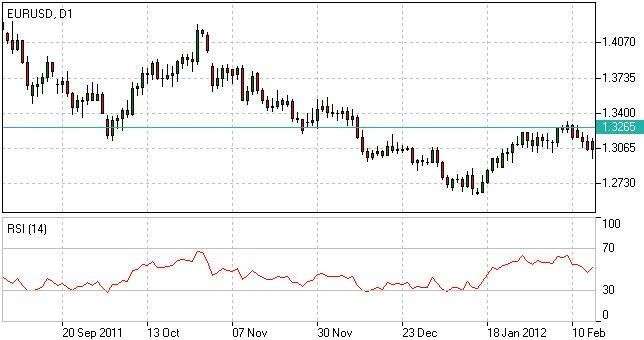
The RSI Trading Strategy’s function is to identify buy and sell signals using the 70- and 30- lines on the chart, as shown below. A dip under 30 means the asset may be oversold, and a hike above 70 means the asset may be overbought.
A trader who aims for a long position must wait for the indicator to fall under 30. Price crossing back over 30 is viewed as a confirmation that the trend is going bullish. To aim for a short position, a trader must wait for the indicator to rise above 70.
Photo taken from www.ifcmarkets.com
Using the RSI Indicator
The RSI identifies possible oversold and overbought areas but must be used with other tools such as trend analysis.
- When the RSI indicator goes above 70 it could mean an asset is overbought.
- When the RSI indicator falls below 30 it could mean an asset is oversold.
When the indicator shows that the price crosses extreme boundaries and bounces to move in the opposite direction, it suggests possible trend corrections or changes.
- When the price crosses the 70-line (overbought line) and moves back downward, it signals an excellent selling opportunity.
- When the price crosses the 30-line (oversold line) and moves back upward, it signals an excellent buying opportunity.
Divergence in the trend indicates its possible weakness.
- If the succeeding high is higher than the previous one, but the indicator does not identify it, that could signal that the upward trend is weak.
- If the succeeding low is lower than the previous one, but the indicator does not identify it, that could signal that the downward trend is weak.
Relative Strength Index Formula
Calculating the RSI first requires determining the value of the relative strength (RS). It is usually calculated for a 14-day period, as shown below.
RSI = 100 – 100/(1 + RS)
RS (14) = Σ(Upward movements)/Σ(|Downward movements|)
To further learn about how to use the RSI, you can download a trading platform where you can practice your trading skills with RSI.