Resistance Level
Resistance level is the level in the trading chart at which the price is anticipated to move in the bearish direction upon contact. The resistance is likened to a “ceiling” since it is the tested level at which price peaks before it drops.
Support and Resistance in Technical Analysis
The Support and the Resistance levels are the highs and lows of a trend, respectively. These are levels where the price attains either “summit” or “trough” more than once, hence considered as a tested support or resistance level. Most traders are willing to buy and sell when the price reaches these levels.
When the price reaches the support level, traders opt to buy or to take long positions as the price is expected to move in the bullish direction. This is the level where majority of the market’s traders have a buying interest that exceeds the selling pressure.
When the price reaches the resistance, traders opt to sell or to take short positions as the price is expected to move in the bearish direction. In this level, the traders’ selling interest exceeds the buying pressure, as shown in the market.
Determining Support and Resistance Levels
Technical Analysis makes use of support and resistance levels to determine the trend and make trading decisions. These two levels identify the market flow and its next possible direction.
The Support is a level that connects the previous lows on the trading chart. A set of lows becomes a “tested support” when the price touches that level more than once.
The Resistance is a level that connects the previous highs on the trading chart. A set of highs becomes a “tested resistance” when the price touches that level more than once.
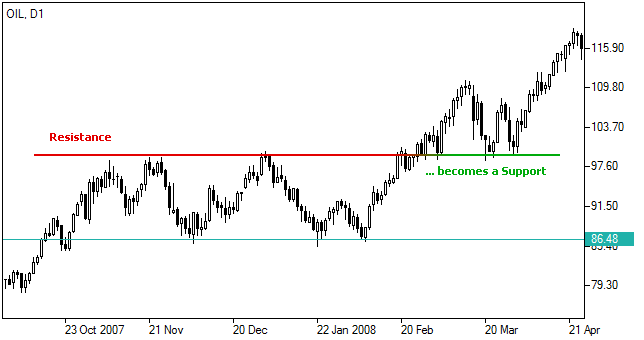
Photo from www.ifcmarkets.com
To identify an uptrend, each succeeding support level must be higher than its precedent; and each succeeding resistance level must be higher than its precedent. Otherwise, if the support or the resistance falls on the preceding lows or highs, respectively, it indicates that the uptrend either comes to an end or it changes to a sideways trend.
The exact opposite is applicable to a downtrend. Each succeeding support level must be lower than its precedent and each succeeding resistance level must be lower than its precedent. If the support or resistance rises from its precedent, then the trend changes.
An uptrend changes into a downtrend when the succeeding highs and lows shift into lower highs and lower lows. Inversely, a downtrend changes into an uptrend when the highs and lows shift into higher highs and higher lows. When the price rises above the resistance, it becomes the new support and when the price falls under the support, it becomes the new resistance. This is called a breakout.
This kind of reversal at support and resistance is referred to as rally, correction, or trend reversal in Technical Analysis.
- When a Support level is broken, traders assume that the price will keep on falling. As the former support becomes the new resistance, it is expected to hold rallies.
- When a Resistance level is broken, traders assume that the price will keep on rising. As the former resistance becomes the new support, it is expected to hold declines.
The new trend is expected to continue as long as the price remains between the new resistance and support.
Trading with Support and Resistance
As the price approaches support, it is the best time for traders to buy and the worst time to sell. However, when the price breaks support and the price continues to fall, sellers might find it a good time to sell.
On the other hand, as the price approaches resistance, traders will opt to sell and less disposed to buy. When a breakout above the resistance happens, traders will more likely buy.
When a breakout happens and the former support becomes the new resistance and vice versa, it can either be a positive or negative effect to the trend. This kind of reversal is essential to market players and analysts as it is their basis for adopting a trading strategy.