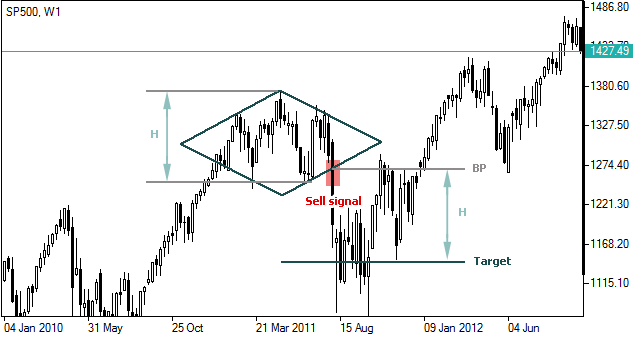
Diamond
The Diamond formation, or commonly known as ‘Diamond top’ is a chart formation or price pattern, which usually indicates a sign of a subsequent reversal of a current uptrend. It is a considered rare pattern in technical analysis.
Forming a Diamond Pattern
The rare diamond pattern is formed almost similar to the “head and shoulders” pattern in which it has a head and a shoulder. However, here, its formation is represented as a four-cornered pattern consisting of two support lines and two resistance lines. The price range between recent low and high prices which is commonly used as a visual indicator for trend lines or resistance lines and upward trend lines or support lines. Resistance lines connect the initial low points and lowest values. Support lines connect the lower points at the approximately same level.
Interpreting from the Diamond formation
The diamond formation is often used for determining a signal to sell or a confirmation of a downward trend. This can be visually detected when market movement crosses the support line going forward, as shown in the figure above.
The formula for determining the target price for the Triangle formation
To determine where and how far the descent should go to consider it a confirmation of a downtrend or a signal to sell, the formula would go as follows:
T = BP – H,
Where:
T – Target Level
BP – Support line (Uptrend line)
H – Height of the Diamond (which is the distance between the highest and the lowest) prices


