Double Bottom

The Double Bottom graphical price pattern is a chart formation that usually indicates a reversal of a current downtrend. It is generally in the shape of the letter “W.”

The formation of the Double Bottom pattern

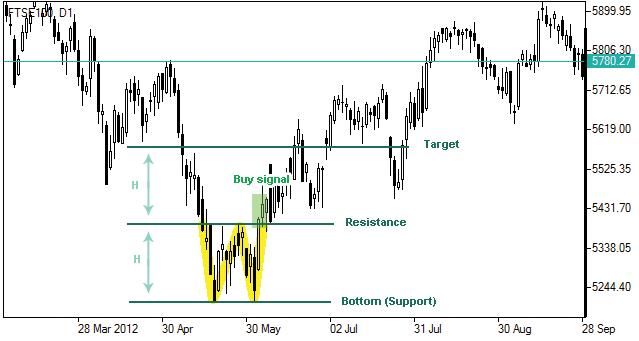
The structure of the Double Bottom pattern is distinct as it is roughly similar to the Latin alphabet “W.” This shape consists of the two lowest price points that were reached recently, and below it, a line drawn would be considered as the support line. The most recent high (before the low points) would determine the resistance line and hence, the signal to buy. Doing so would create the lines as seen below:

Interpreting the Double Bottom

Once the support and resistance lines are determined, analysts can now spot or visually see either the price direction heading on an upwards trend or see it as an indicator to buy. The signal and/or confirmation can be decided when the market direction crosses above the resistance line.

The formula for determining target price for the Double Bottom formation

To decide on what price would be the signal to buy, the target price for the Double Bottom formation would be as follows:

T = R + H

Where:

T – Target Line

R – Resistance Line (determined from the local high)

H – Height of the Pattern (determined by the distance between the support and resistance lines)


Double-Bottom

Risk disclaimer "TS Software Ltd – Trust Company Complex, Ajeltake Road, Majuro, Ajeltake Island, MH 96960, Marshall Islands is a financial services institution outside the European Union Area, which is subject to the supervision of the IFMRRC Certificate 0395 AA V0155 Trading in Forex/ CFDs and Other Derivatives is highly speculative and carries a high level of risk. It is possible to lose all your capital. 70% of trading deals can be unprofitable. These products may not be suitable for everyone and you should ensure that you understand the risks involved. Seek independent advice if necessary. Speculate only with funds that you can afford to lose. This Website may contain information in particular regarding financial services and products that could be regarded b a E.U. supervisory authority as an offer of financial services targeted in Europe. ESMA intervention measures do not apply to customers of TS Software Ltd and it is your responsibility to choose a company which is most suitable for your trading needs. By clicking continue you confirm that you have read, understood and agree to the risk disclosures, terms of service, cash policies, privacy policies and this notice and that you are visiting this website on your own initiative, without any encouragement whatsoever from umarkets.net or TS Software Ltd." Cookies notification: We use cookies to ensure that we give you the best experience on our website. If you continue to use this site we assume that you are happy with it. Read more. Continue
×

Help with deposit?