Descending Triangle
A Descending Triangle is a graphical representation of bearish-focused price patterns mostly used in technical analysis to determine and confirm existing trend continuation.
Formation of a Descending Triangle
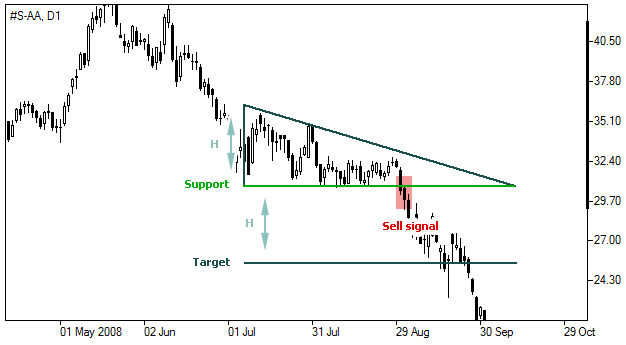
It is visually represented through a narrowing range of lines originating from high and low prices to a point where it meets, representing a triangle in the end.
The main feature peculiar of this type of the Descending triangle is that it would generally have a descending trend line (or a resistance line) joining the lower points and lower highs. From here, a horizontal trend line (or the support line) would connect the lower points at approximately the same level. It is visually represented through a narrowing range of lines originating from high and low prices to a point where it meets, representing a triangle in the end.
Interpreting a Descending Triangle
After determining the points to form a descending triangle, analysts can confirm on a downward trend in the market or a signal to sell. This can be identified when the price movement crosses below the support line and has approximately covered a third of the distance toward the Target Price line.
Targeting a Price Level
It is assumed that after the formation of the figure according to the pattern of the descending triangle, the cost usually falls to the target level. This will be calculated as follows:
T = S – H
Where:
T – Target price level;
S – Support (horizontal line);
H – Height of the figure (the distance between the lines of support and resistance at the beginning of the figure)


