Symmetrical Triangle

The symmetrical triangle is a trading pattern that consists of simultaneous uptrend and downtrend lines. It shows a situation where supply and demand reached equilibrium or when a security’s price is consolidating. 

Pattern Formation

This is identified as a price range of highs and lows narrowing to the extent that it forms a symmetric triangle positioned sideways. This type of pattern formation shows a descending resistance trendline and an ascending support trendline until the two meet at the center point. Both trendlines’ angles are almost of the same degree. 

Photo taken from www.ifcmarkets.com

Interpretation of the Pattern

The Symmetric Triangle shows the movement and direction of the trend in case a breakout happens.

  • When the triangle forms in a downtrend and the price breaks support, it is a good time to sell.
  • When the triangle forms in an uptrend and the price breaks resistance, it is a good time to buy. 

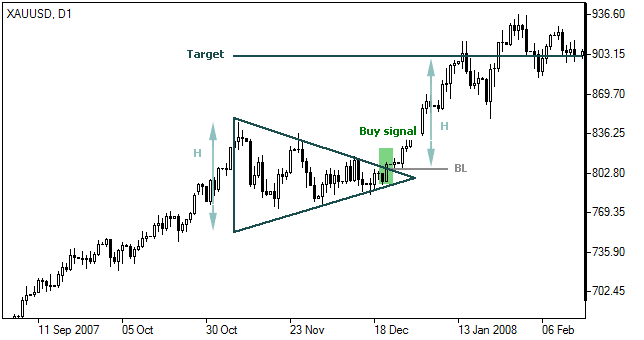
Symmetrical Triangle Formula

In Symmetrical Triangle, a target price is calculated based on the successive descending resistance trendline and ascending support trendline. In the pattern formation, the center point at which the two trendlines meet is considered as the target price. This target price is calculated as follows:

In case of an uptrend:

T = BL + H

In case of a downtrend:

T = BL – H

Where:

T – target price;

BL – breakthrough level (point where the price leaves the triangle);

H – pattern’s height (distance between support and resistance lines at pattern’s origin)

symmetrical-triangle


Risk disclaimer "TS Software Ltd – Trust Company Complex, Ajeltake Road, Majuro, Ajeltake Island, MH 96960, Marshall Islands is a financial services institution outside the European Union Area, which is subject to the supervision of the IFMRRC Certificate 0395 AA V0155 Trading in Forex/ CFDs and Other Derivatives is highly speculative and carries a high level of risk. It is possible to lose all your capital. 70% of trading deals can be unprofitable. These products may not be suitable for everyone and you should ensure that you understand the risks involved. Seek independent advice if necessary. Speculate only with funds that you can afford to lose. This Website may contain information in particular regarding financial services and products that could be regarded b a E.U. supervisory authority as an offer of financial services targeted in Europe. ESMA intervention measures do not apply to customers of TS Software Ltd and it is your responsibility to choose a company which is most suitable for your trading needs. By clicking continue you confirm that you have read, understood and agree to the risk disclosures, terms of service, cash policies, privacy policies and this notice and that you are visiting this website on your own initiative, without any encouragement whatsoever from umarkets.net or TS Software Ltd." Cookies notification: We use cookies to ensure that we give you the best experience on our website. If you continue to use this site we assume that you are happy with it. Read more. Continue
×

Help with deposit?