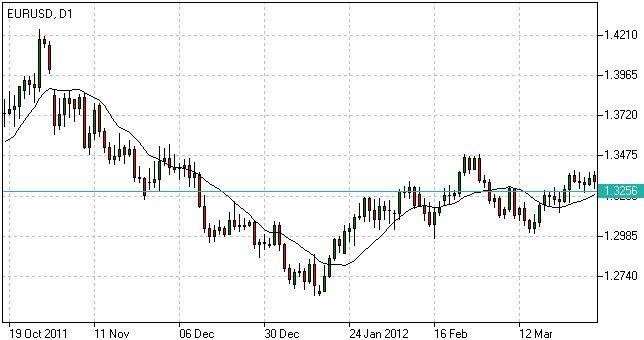
MOVING AVERAGE INDICATOR
This kind of tool is commonly applied in technical analysis to reveal averages prices over a specific time. Such is essential to flatten price inconsistencies and to identify trend direction and strength.
HOW TO USE MOVING AVERAGE
The principles used in analyzing moving average curves are the following:
- The direction of a moving average curve is indicative of the prevailing trend.
- False signals tend to dominate the chart during low-period averaging, while a long period tends to struggle.
- The sensitivity of the curve is dependent on the averaging period. For a highly sensitive curve, one should minimize the period of averaging. For a low sensitive curve, an averaging period should be increased.
- Average curves are essential in trending environment.
THE DIFFERENCE BETWEEN MOVING AVERAGE AND PRICE MOVEMENTS
- A strong buy signal is expected to show up once the price overlaps from below its rising moving average curve. More so, a strong sell signal will appear if the price overlaps from above its falling average curve.
- A weak buy signal is expected to show up once the price overlaps from below its falling moving average curves. More so, a weak sell signal will appear if price crosses from its rising moving average curve.
THE DIFFERENCE BETWEEN MOVING AVERAGE CURVES OF DIFFERENT PERIODS
- When a rising lower-period curve overlaps from below another rising longer period curve, it denotes a strong buy signal. However, when a falling lower-period curve is overlapping from above another falling longer-period curve, it denotes a strong sell signal.
- When a rising lower-period curve overlaps from below another falling longer-period curve, it indicates a weak buy. However, if a falling lower-period curve overlaps from above another rising longer-period curve, it means that sell signal is weak.
MOVING AVERAGE TRADING STRATEGY
Moving average is a trend following tool. It is used to determine the start of a new trend and a possible trend reversals. Though this is heavily used in technical analysis, it endeavors to follow the development of a specific trend completely disregarding market actions, unlike what technical analysis aims to do.
It is best to calculate the average price over a specific period to compute simple moving averages.
SMA = Sum (Close (i), N) / N,
where:
Close (i) – current close price;
N – period of averaging.
To come up with the exponential moving average, one must consider the prices of the previous period.
EMA(t) = EMA(t-1) + (K x [Close(t) – EMA(t-1)]),
where:
t – current period;
K = 2 / (N + 1), N – period of averaging.


