MOVING AVERAGE ENVELOPES
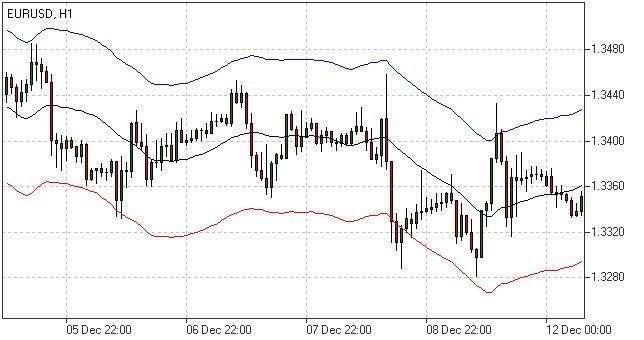
An envelopes indicator projects the current state of an oversold or overbought price. This helps traders assess the ideal entry and exit points and identify the probability of trend break-downs.
HOW TO USE ENVELOPES INDICATOR
An envelope is composed of two simple moving averages that create a channel wherein the price moves. These averages surround moving averages and are placed in a constant percentage distance. Such a position is not absolute, as it can be adjusted in line with the current market volatility. Lines that compose an envelope serve as margins of the fluctuation range.
During a trend, it is ideal for taking oversold signals if the market is uptrend. During a downtrend, consider taking overbought signals.
ENVELOPES INDICATOR FORMULA
The distance of the volume of deviation from the moving average must be placed according to the low volatility to determine the upper and lower lines.
Upper Band = SMA(CLOSE, N)*[1+K/1000]
Lower Band = SMA(CLOSE, N)*[1-K/1000]
Where:
SMA is the simple moving averages,
N is the averaging period,
K/1000 is the value of shifting from the average.

Cookies notification: We use cookies to ensure that we give you the best experience on our website. If you continue to use this site we assume that you are happy with it. Read more.

