MOVING-AVERAGE CONVERGENCE/DIVERGENCE INDICATOR
Gerald Appel introduced the Moving-Average Convergence/Divergence Oscillator with a primary aim of exposing changes in directions and trend’s strength. To reveal such, it merges signals from three-time series of moving average curves.
USING MACD INDICATOR
MACD, shown as a blue line, releases three primary signals, which are a signal line, x-axis, and divergence patterns.
CROSSOVERS WITH THE SIGNAL LINE:
The signal is bullish and suggests price growth acceleration once the MACD line is more fast-paced than the signal line and if it overlaps from below.
The signal is bearish and suggests a price loss extension once the MACD plummets faster than the signal line as it overlaps from above.
CROSSOVERS WITH X-AXIS
It is considered a bullish signal once the MACD line places itself above zero. And it is a bearish signal if the MACD places itself below zero.
CONVERGENCE/DIVERGENCE
Convergence happens when the MACD line goes in the same direction as the price. If this happens, it affirms the price move. When both lines move to opposite directions, it is now called divergence. For example, when a price moves without any indicator, it denotes weakness.
MACD TRADING STRATEGY
This is heavily used to identify buy and sell points. Its values reach above and below the zero line. An overbought condition happens when MACD and signal lines are far above the zero line. When this happens, selling is viable. However, an oversold condition happens when both lines are located below the zero line. Such denotes a buy signal.
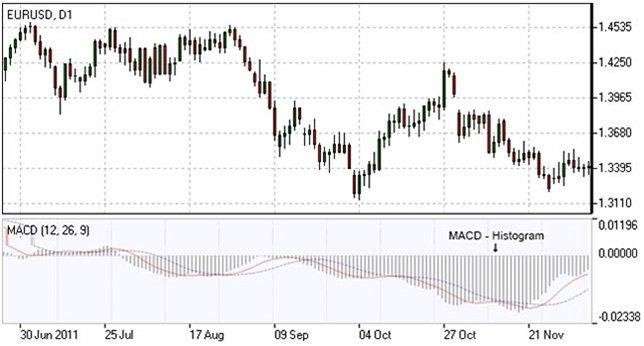
When using MACD, it is necessary to be familiar with the MACD histogram. The histogram has vertical bars that project two lines’ difference. The histogram can be found above the zero line just when MACD lines are aligned positively. This means that the faster line is moving above the slower line. The current trend is losing its strength when the histogram is located above the zero line but starts to approach downward zero line. In respect, when the histogram starts below zero line and approaches zero line, it implies downtrend weakness.
Signals appear at zero line intersections. Buy and sell signals unravel only after the histogram overlaps zero line as the latter gives out forecast about risks.
MACD INDICATOR FORMULA
To compute MACD, a 26-period exponential average must be deducted from a 12-period moving average.
MACD line = 12-period EMA – 26-period EMA
Signal line = 9-period EMA
Histogram = MACD line – Signal line


