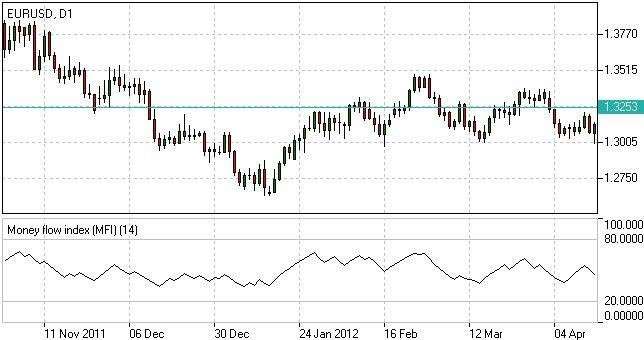
MONEY FLOW INDEX
This technical indicator was developed to calculate money inflow intensity into a particular asset. It compares price increases and decreases in a specific period. It shows the overall estimation of inflow intensity, all while considering the role of trading volumes.
HOW TO USE MONEY FLOW INDEX
This indicator is used to analyze whether a particular asset is overbought or oversold. This also identifies the probability of reversal.
An asset is said to be overbought when the MFI soars above 80 to analyze extreme areas. A sell signal will show up once the MFI overlaps the overbought area from above. However, if MFI drops below 20, it is now an oversold asset. A buy signal will appear, indicating that the MFI overlaps the oversold area from below.
DIVERGENCE PATTERNS ANALYSIS
Once the MFI rises together with decreasing prices, it denotes that a downtrend is fluctuating. If MFI and rising prices fall together, it means that the uptrend is weakening.
To compute,
- TP = (H + L + C) / 3;
- MF = TP*Vol;
- MR = Sum(MF+) / Sum(MF-);
- MFI = 100 – (100 / (1 + MR)),
where:
TP – typical price;
H – current high;
L – current low;
C – close price;
MF – money flow (positive (MF+) if current TP > previous TP, negative (MF-) otherwise);
Vol – volume;
MR – money ratio.


