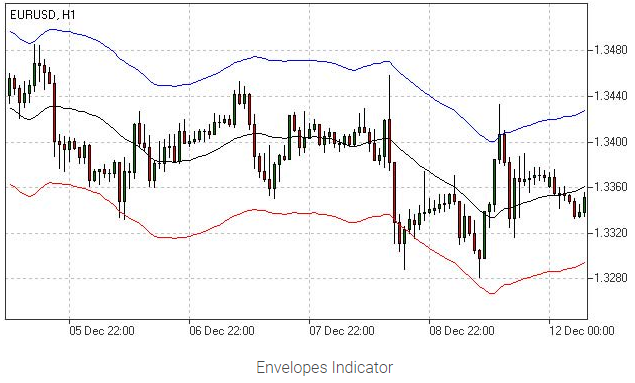
Envelopes Indicator
An Envelopes Indicator is a technical analysis tool that reflects off either the overbought (upper) or oversold (lower) bounds of the trading price plotted through trend lines in a graphical representation of data or price chart. This would determine entry and exit limits for price fluctuations and signify possibilities of a turn in trend.
Reading Envelopes
The envelopes indicator consists of 2 simple moving averages (or SMAs) forming a pattern similar to a Channel formation where the upper and lower SMAs act as boundaries. However, instead of a straight line, the envelope is a ridged and flexible line that is plotted by the Moving Average of the price movement caused by market volatility.
Formula to determine Upper Band and Lower Band of an Envelope
The calculation of the upper and lower bands in an envelope is based on the average taken from the Moving Average, which is set by the volatility of the asset. The formula for the upper and lower bands are as follows:
Upper Bar = SMA (Close, N)*[1+k/1000]
Bottom Bar = SMA (Close, N) * [1-K/1000]
Where:
SMA = Simple Moving Average
N = Averaging Period
K/1000 = the range of fluctuations moving from the average (this is measured in basis points)


