
Shooting Star Candlestick. How to Trade Like a PRO Using Shooting Star Pattern
The Shooting Star pattern is a common candlestick position that often appears right at the top of a generally bullish trend. The pattern only consists of a single candlestick, although it has several interesting components:
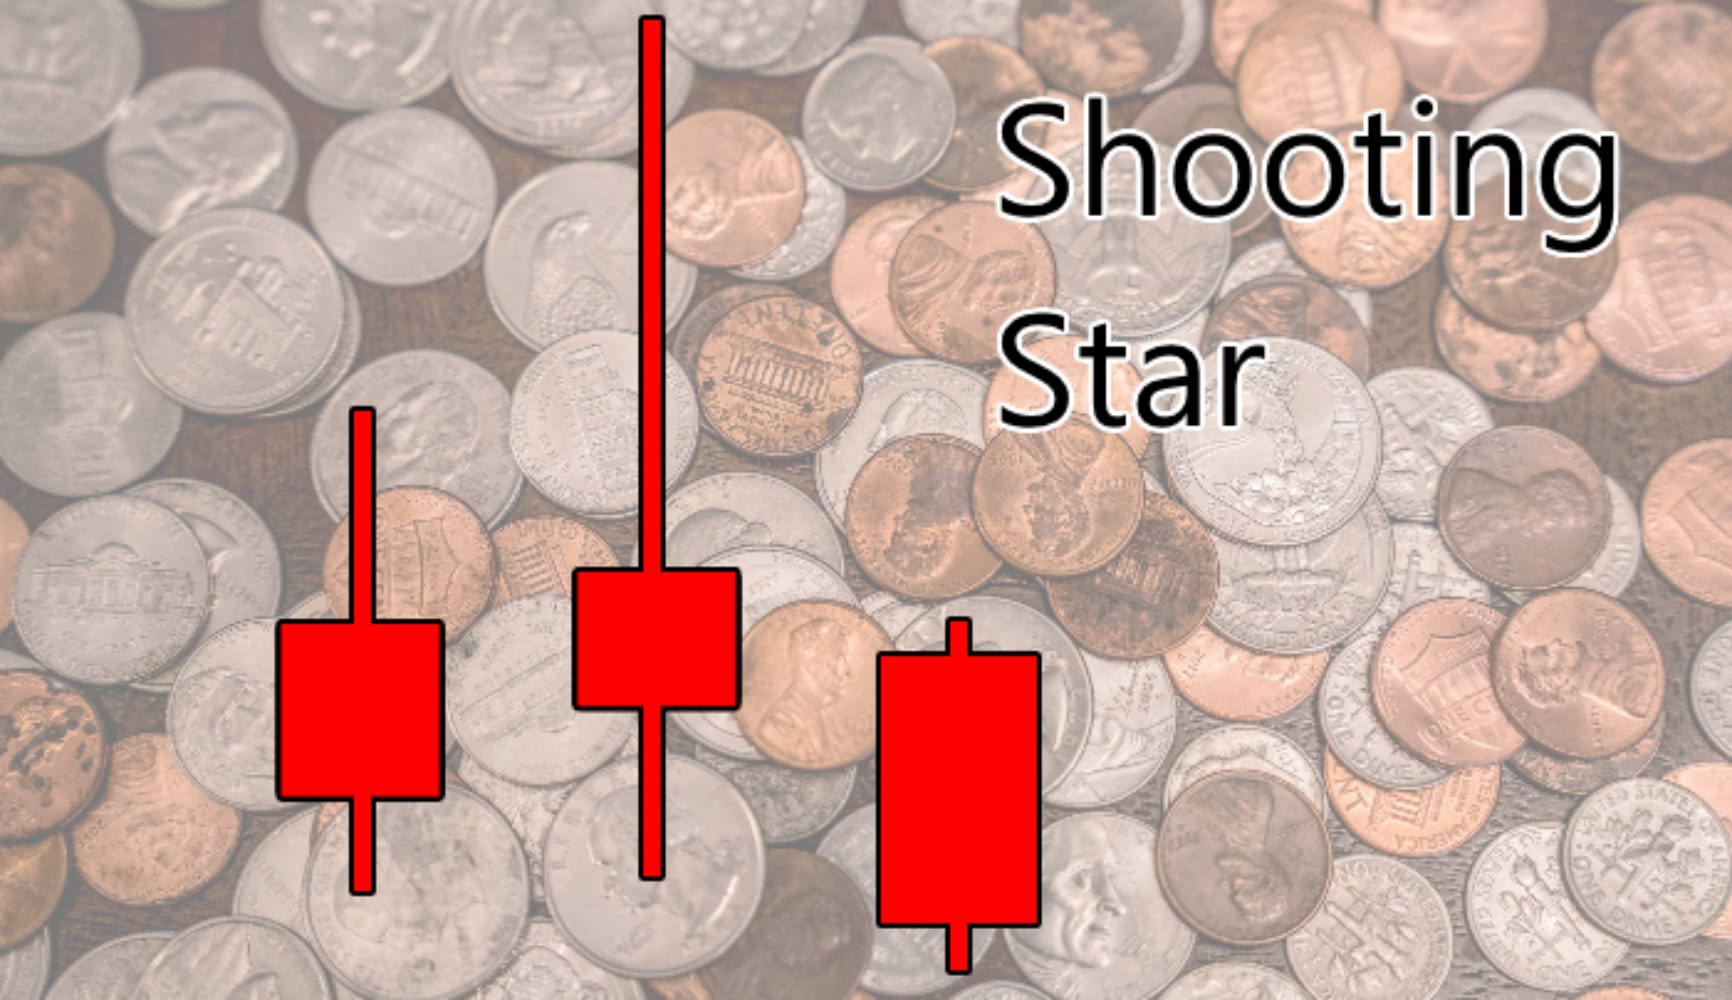
- The candlestick itself is often red (bearish), although the exact size may vary
- The wick typically sticks upwards and has an extraordinary length (at least twice the size of the candlestick itself)
The Shooting Star usually leads to a sharp reversal of a trend. As mentioned, this form is always at the top of the upward trend and acts as a culmination of otherwise successful price growth. Naturally, it signals that it’s time to sell or open a short position because the asset value is about to drop.

What does Shooting Star mean?
The Shooting Star is common enough for the observant traders to understand the tendency and make reasonable decisions before the price drops. After all, it’s very easy to spot. Wicks don’t usually exceed the candle bodies so much in length. But why do they do that in this case, anyway?
Well, trends can’t go on forever, and they all eventually hit the ceiling or the floor. The floor is professionally known as a ‘support zone’, and the ceiling is usually called ‘resistance’. An asset reaches a resistance point when it can no longer support the growing demand and price and just pushes away all the attempts to buy high. That’s exactly why it’s called resistance.
The bearish (downward) trend that follows after that is obvious – the supply depletes and can’t support the mounting demand, so the price drops, and the balance is restored. But before realizing that supply is depleted, the traders probe the market to see if there is something left.
If there are more assets in stock, the growth will continue and many attempts to buy higher will be fulfilled. However, if the supply is gone, the attempts will remain largely hollow and the few purchases that happened will have the same (or near it) price at the end of the day as at the start.
How does the Shooting star come to be?
The wick, as you know, represents the extremes. If someone tried to buy high, but the price didn’t change much in the end – the wick will be a lot longer than the body itself. That’s exactly what happens.
To sum it up:
- The traders try to gradually mount the price over the course of the day.
- The attempts largely fail because the short supply can’t support too many high sales.
- The market decides to buy the remaining assets at a smaller price.
- The price at the end of the day returns to the opening price.
- The value doesn’t change, but the attempts were made.
- The trend dies down.
So, if you make a graph that represents the top prices of the asset during the day, you’ll see a fairly tall arch that starts and ends at almost the same points. This is why it’s called the Shooting Star – the price starts to fall at a curve after some time.
How to find the Shooting Star
The long wick on top of the Shooting Star candle is accurately named the ‘upper shadow’. This shadow reflects the progress of the market value over the course of the day, but doesn’t actually influence the end result.
If you want to identify this pattern, look for the upper shadow once the trend starts to mount too high. If you find a candle with a long wick sticking out the top of it, it means the trend has hit its resistance point and it’s time to bail. You are highly advised to sell at this point because no one else is going to wait to see what happens.
The SS pattern is very recognizable – many traders see it from a mile away. Even without the wick to help you, the body of the candlestick doesn’t take any favorable poses during this stage. It’s either very short (which signifies slowing down of the trend) or obviously bearish (which signifies an early reversal). By the next day, the price will fall.
You can also try to anticipate this pattern by watching the volume and the supply very closely. The supply shortage isn’t too easy to spot, only if you’re very apt at analyzing the news. But if the volume of trades continues to mount (as does the price), you should watch the trend closely.
The body of the Shooting Star isn’t always short, it can be relatively long. Regardless, it’s never the high of the value – the utmost high is the day before the pattern.
You can use the Relative Strength Index (RSI) to try and see if the demand is going to outstrip the supply soon. If the index is above 70 (out of 100), the asset is starting to experience underselling and shortage. In any case, it’s your responsibility to decide how to deal with the eventual drop in value.