
Dark Cloud Cover Candlestick: Definition & Example. Why This Pattern is So Important for Traders
Points of the trend reversing are crucial for trading. Whenever a trend is about to change direction, the time comes for many investors to decide what to do with their stock of assets. Bearish reversal (downward shift) is perhaps more game-changing than the bullish one (upward shift).
There are many candlestick combinations used by traders to indicate the change of trend’s character: Evening Star, Shooting Star, Inverted Hammer, and so on. Dark Cloud Cover pattern is one of the rarer ones because it implies a more calculated and decisive shift, which doesn’t often happen on the market, chaotic as it is.

What is a Dark Cloud Cover?
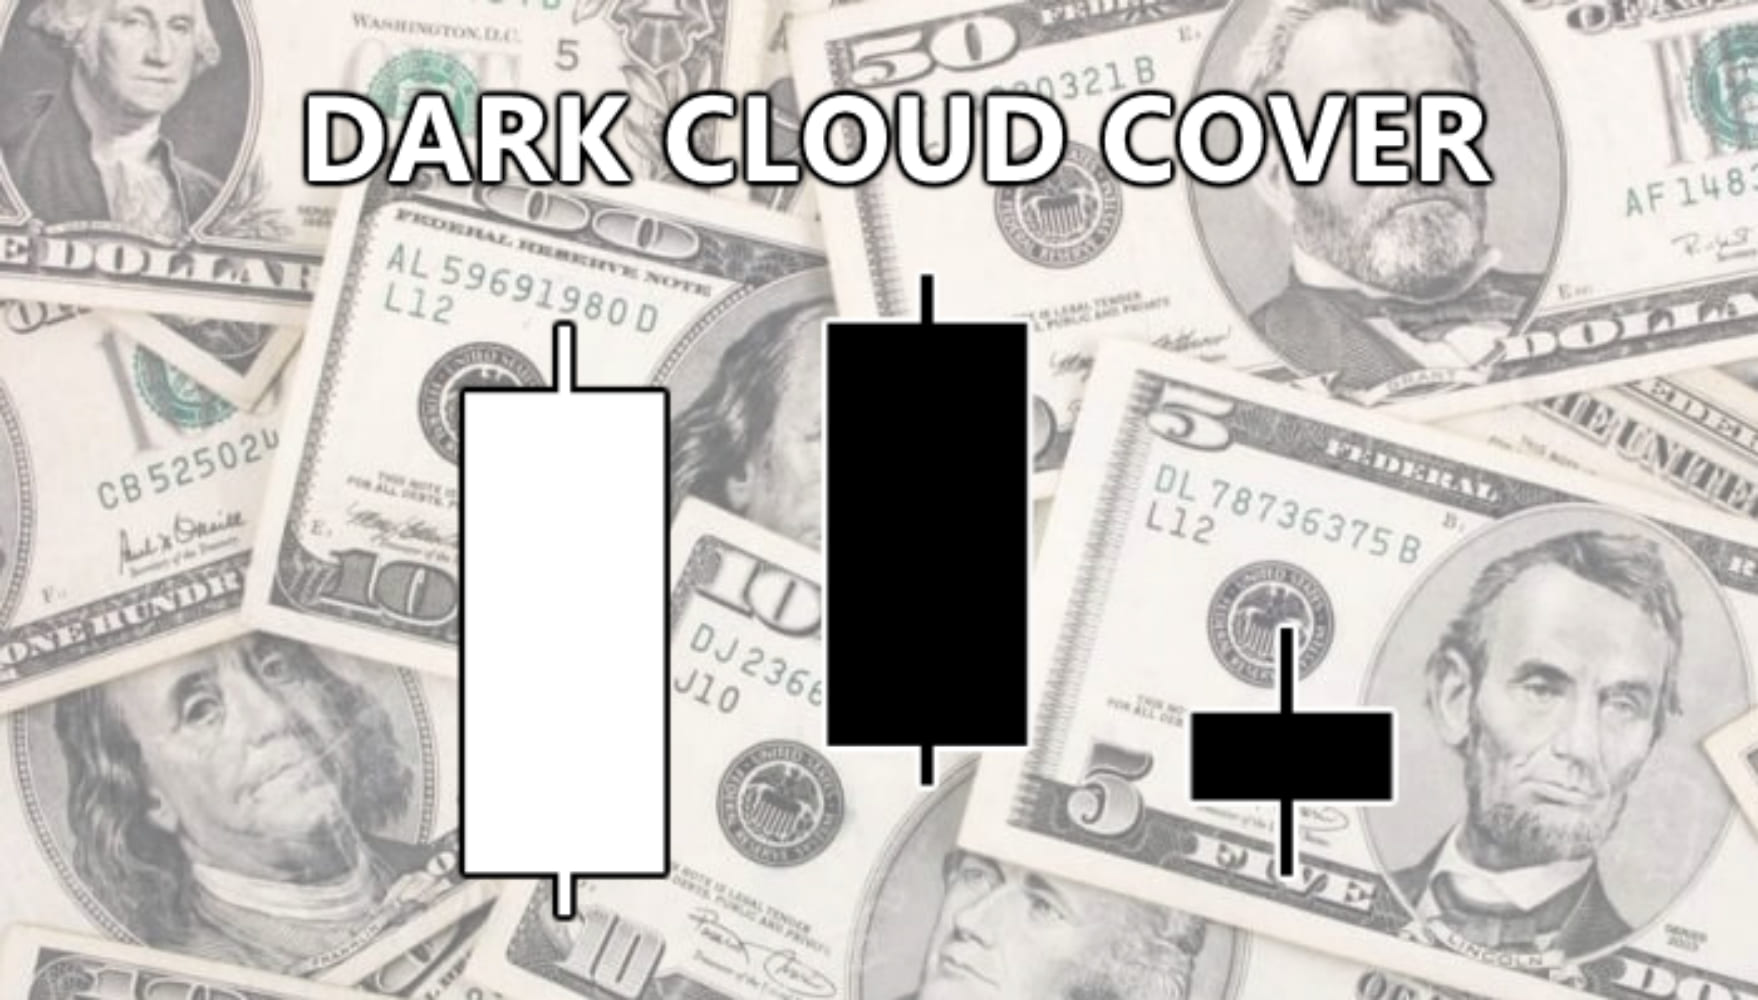
Dark Cloud is a combination of three candlesticks that mostly arise near the resistance zone, at the top of the chart. The combination is as follows:
- A left green candle (upward trend) with a long body and moderate wicks.
- A middle red candle (downward change) that starts just above the top of the previous stick and ends just below the middle.
- A last red candle with an insignificant size, posing as a confirmation.
It’s important to note that wicks on all of these candles are generally small, especially on the middle candle. As mentioned, the move to drop the price must be relatively decisive and market-wide. Therefore, the extreme low and high prices (which the wicks demonstrate) are often very small compared to the bodies.
The ‘Dark Cloud Cover’ is an old name, dating back to the time when black and white candles were much more common than red and green ones. If you turn the first two sticks 90° counterclockwise, you’ll see that the big bearish candle almost completely hides the bullish one, as if a cloud. That’s what the name indicates.
What does Dark Cloud mean?
The appearance of one reverse pattern or another heavily depends on the preceding circumstances. The Dark Cloud candlestick happens when it’s become clear that the trend is going to change sometime before it actually did.
It may be due to the leaked news about the market in question or due to the shortages of volume when the trend was still climbing.
For this reason, the candles before the Cloud are often more-or-less short – the price doesn’t climb too decisively. The main sticks of the pattern are also rarely too long.
The prices usually climb just enough on the first day. Then, the market typically starts the next session with the price almost identical to the previous closing value (the trend still being considered a bullish one).
During the second day, the price slowly went down. That’s how the main bearish stick is created. On the third day, the traders usually lower the price just a little bit to confirm that the pattern has been proven correct.
How does a Dark Cloud Cover come to be?
The DCC pattern can come up as a follow-up to some event that changes the market or is about to. Generally, however, the candlesticks form this way as a culmination of an already slow market.
As a consequence, the momentum of the market is not really accumulated, and it dies down fairly smoothly as soon as people realize the trend has reached its limits.
After that, the following bearish trend gradually accumulates momentum. The downward trend soon becomes more active than the previous upward trend, but then slows down. However, it only applies to the typical examples. The parameters may vary.
For instance, the candles may be much smaller than usual, in which case the effect on the market will also be not as significant as with standard-sized DCC candles.
How to use DCC?
The DCC needs confirmation because of its careful and smooth nature. The effect of the pattern relies on many parameters, such as demand, supply, trading volume, and so on. The second candle may very well be just a temporary bearish downturn, especially if the size of the candles isn’t what’s usually expected of a DCC.
The trend may yet bounce back up, and this is exactly the reason why most traders wait until the third day is over to confirm their fears or hopes.
So, if your decision is to sell your assets while the price is still high enough, it’s better to do it on the third day. The price isn’t going to change a lot on the third day anyway because everyone else is also waiting for the confirmation.
If something unexpected happens and the price does bounce back sharply, the resulting trend will be quite unpredictable, so it’s better to bail on the third day anyway.
How to predict DCC?
Unsurprisingly, Dark Cloud Cover follows some specific market rules, and you can keep a watch on them to anticipate the pattern properly.
Those bearish reversals that resemble DCC happen as a result of a decreased supply, decreasing volume and increasing demand. Whenever an asset is close to being overbought, the reversal happens.
In most situations that affect the volume, it’s a good idea to use the RSI (Relative Strength Index). This index shows on a scale from 0 to 100 how often the asset is sold compared to the recent sessions. Numbers over 70 indicate the overbuying, which will eventually deplete the stock and cause a reversal.
It also could be effective to watch exactly how much momentum the sales have. If the prices rise too fast, there will likely be some other pattern instead of the Cloud. The Clouds happen smoothly and slowly.