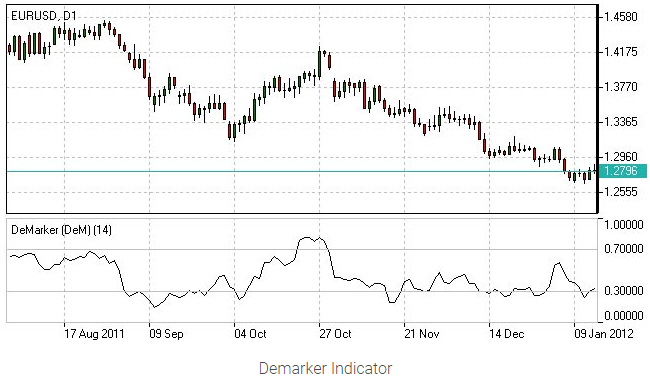
DeMarket (DeM) Indicator
The DeMarker Indicator or DeM was developed by Tom Denmark as an oscillator to figure out and spot potential opportunities at the most minute detail to gain signals for entering and exiting the market.
Interpreting a DeMarket Indicator
Using the DeMarket indicator would show potential overbought and oversold conditions in the market. It is an oscillator measured between a band between 0.0 and 0.1 or (0 and 100). When the price movement reaches 0.7 or above, it would suggest a decrease in volatility and a price drop. When the price movement reaches 0.3 or below, this would indicate a chance that the price could rise.
Formula for calculating the DeMarker Indicator
The DeMarker Indicator Formula is the amount of all possible price increase during a particular time frame (indicated as the letter “I”) and is divided by its minimum value:
The DeM has two components which are:
DeMax: which compares the recent high point to the previous ones.
[DeMax(i)] is calculated as follows:
If high(i) > high(i-1) , then DeMax(i) = high(i)-high(i-1), otherwise DeMax(i) = 0
DeMin: which compares the recent high point to the previous ones.
[DeMin(i)] is calculated as follows:
If low(i) < low(i-1), then DeMin(i) = low(i-1)-low(i), otherwise DeMin(i) = 0
Then, the value of the DeMarker is calculated as:
DMark(i) = SMA(DeMax, N)/(SMA[DeMax, N]+SMA[DeMin, N])
Where:
SMA – Simple Moving Average
N – Number of periods used in the calculation


